Case 02 · Cross-Market Ops
Cross-Market Operations Compliance Tool
In short
Problem
Teams worked around a global compliance tool.
What I did
I redesigned it to track progress and show every market's status.
Outcome
Faster assessments
4×
Speed
User satisfaction
+45%
Sat
- Cross-Market Ops
- UX/UI Designer
- PowerApps Compliance Tool
- May – Aug 2024
- Shipped
01Context
An officer could stop on Friday and be lost by Monday
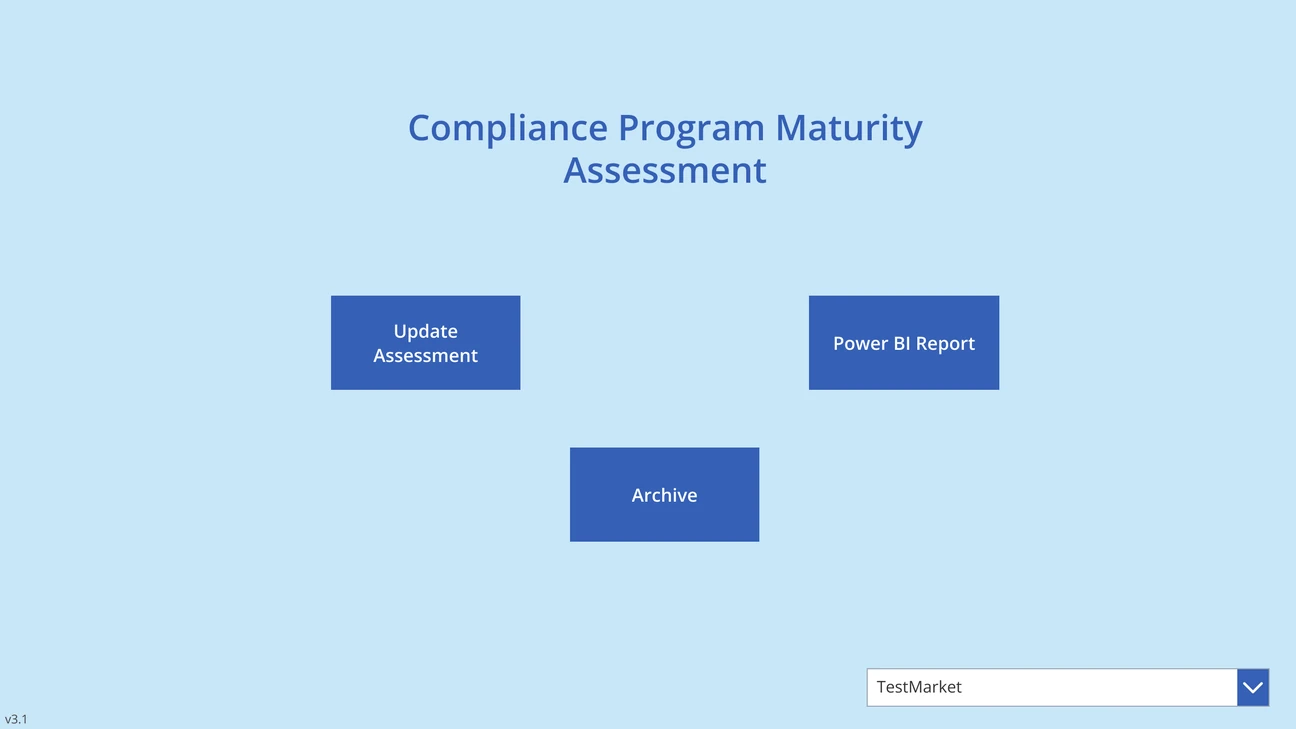
Assessments take weeks, and the tool opened on three buttons, with no sign of where anyone stopped.
Around the world, compliance officers score their market against a list of standards, and one assessment can take weeks. The tool built for it opened on three buttons and a market picker. Nothing said what was assigned, what was due, or where they had stopped.
The real work had moved to spreadsheets
The client told us teams tracked progress in spreadsheets. I was brought in to fix the forms.
Officers and managers were tracking the real work in spreadsheets, emails and their own notes, the client told us. I was brought in as the designer, working with a PM and Power Apps developers, to fix the forms. The forms were only part of it.
More detail
What I owned
I audited the system, reframed the product vision and aligned the UX with user needs. Two user groups — market teams entering assessments and managers overseeing them — both needing clarity at different points.
02The problem
Every failure sat between the screens
No screen showed more than one market, what was overdue, or an officer's progress.
Auditing the tool, I found each screen was a dead end. None showed more than one market, so managers had no overview. Nothing knew which markets were overdue or never assessed. And no screen kept track of an officer's progress.
03The assessment
The form made officers do the remembering
No market name, scores as coloured dots, no progress count, and comments in a separate tab.
Officers worked on the assessment form for weeks. It didn't name the market it covered. Scores were a coloured dot, with no number. No tab showed how many questions were done. Comments lived in a separate tab, away from the question they discussed.
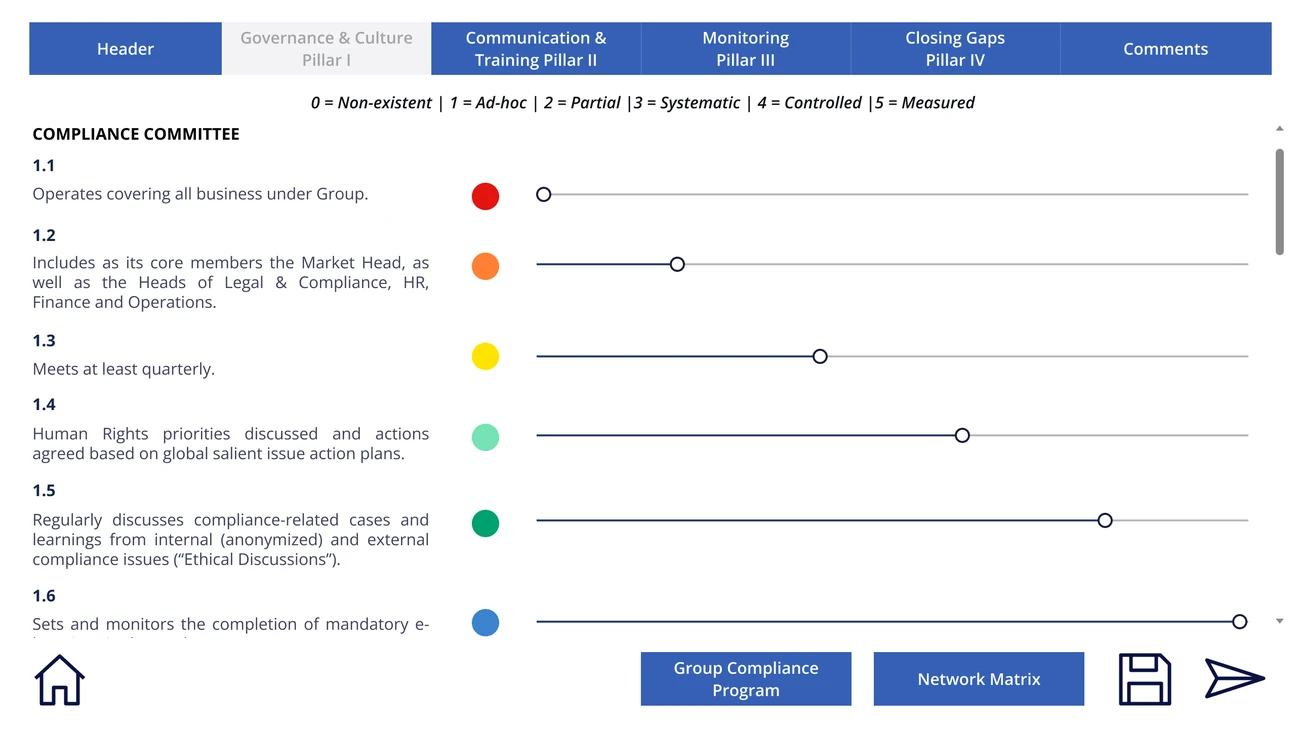
Five findings on this screen. Hover a point below to mark its area on the image; select it to zoom in.Five findings on this screen. Tap a point below to mark its area on the image and zoom in.
04Decisions
The tool had to start keeping track
Three rules: every screen shows its status, work stays where it's left, every score names its number.
The goal changed from better forms to a tool people could make decisions in. That meant three rules. Every screen shows its own status. Progress and comments stay where the work is. And every score names its number, with the criteria close at hand.
More detail
The three rules, problem by problem
The brief was “fix the forms”, and the forms were genuinely bad. But every failure sat between screens, not on one, and a better-laid-out form fixes none of those.
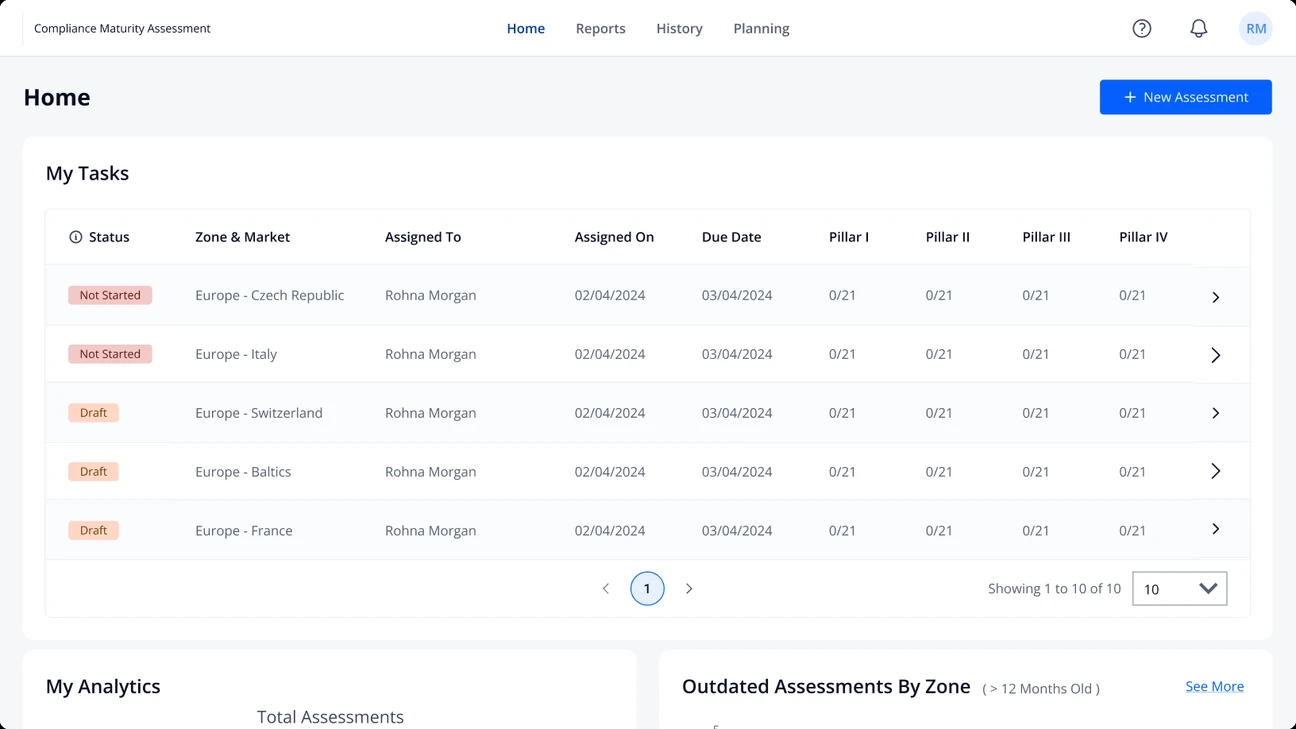
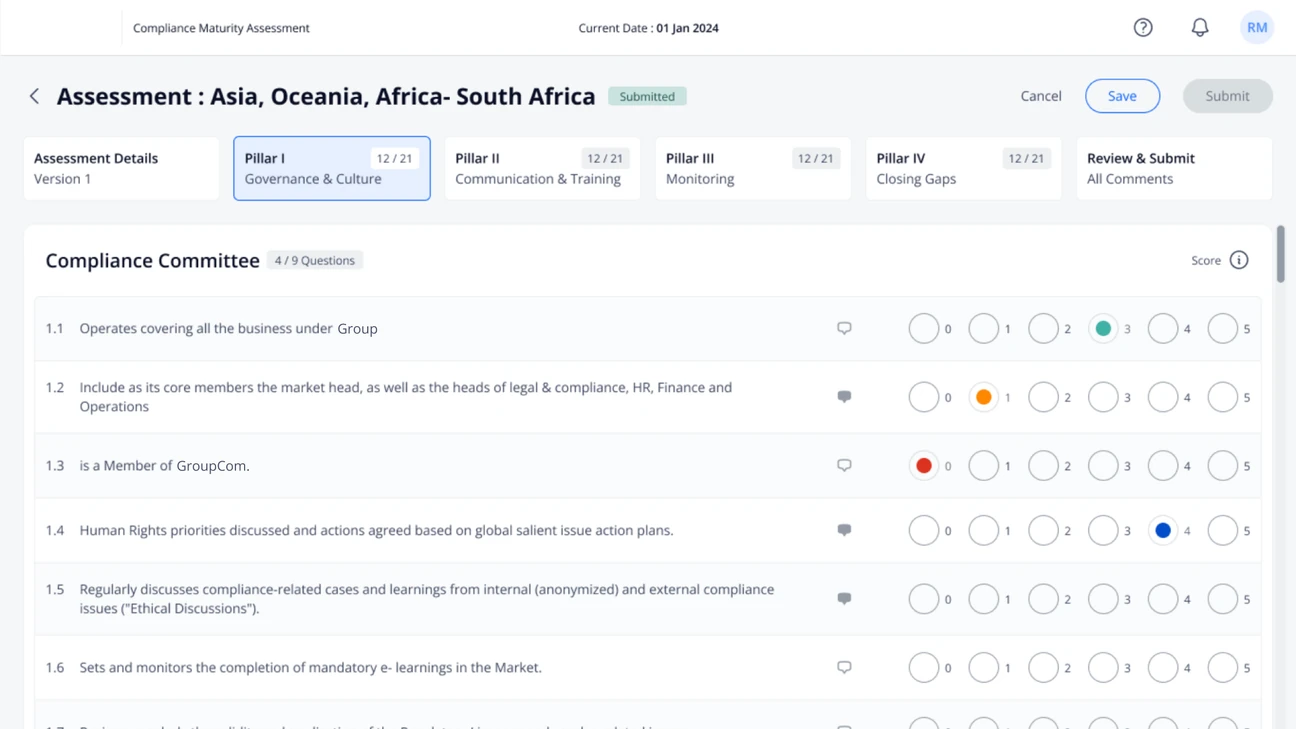
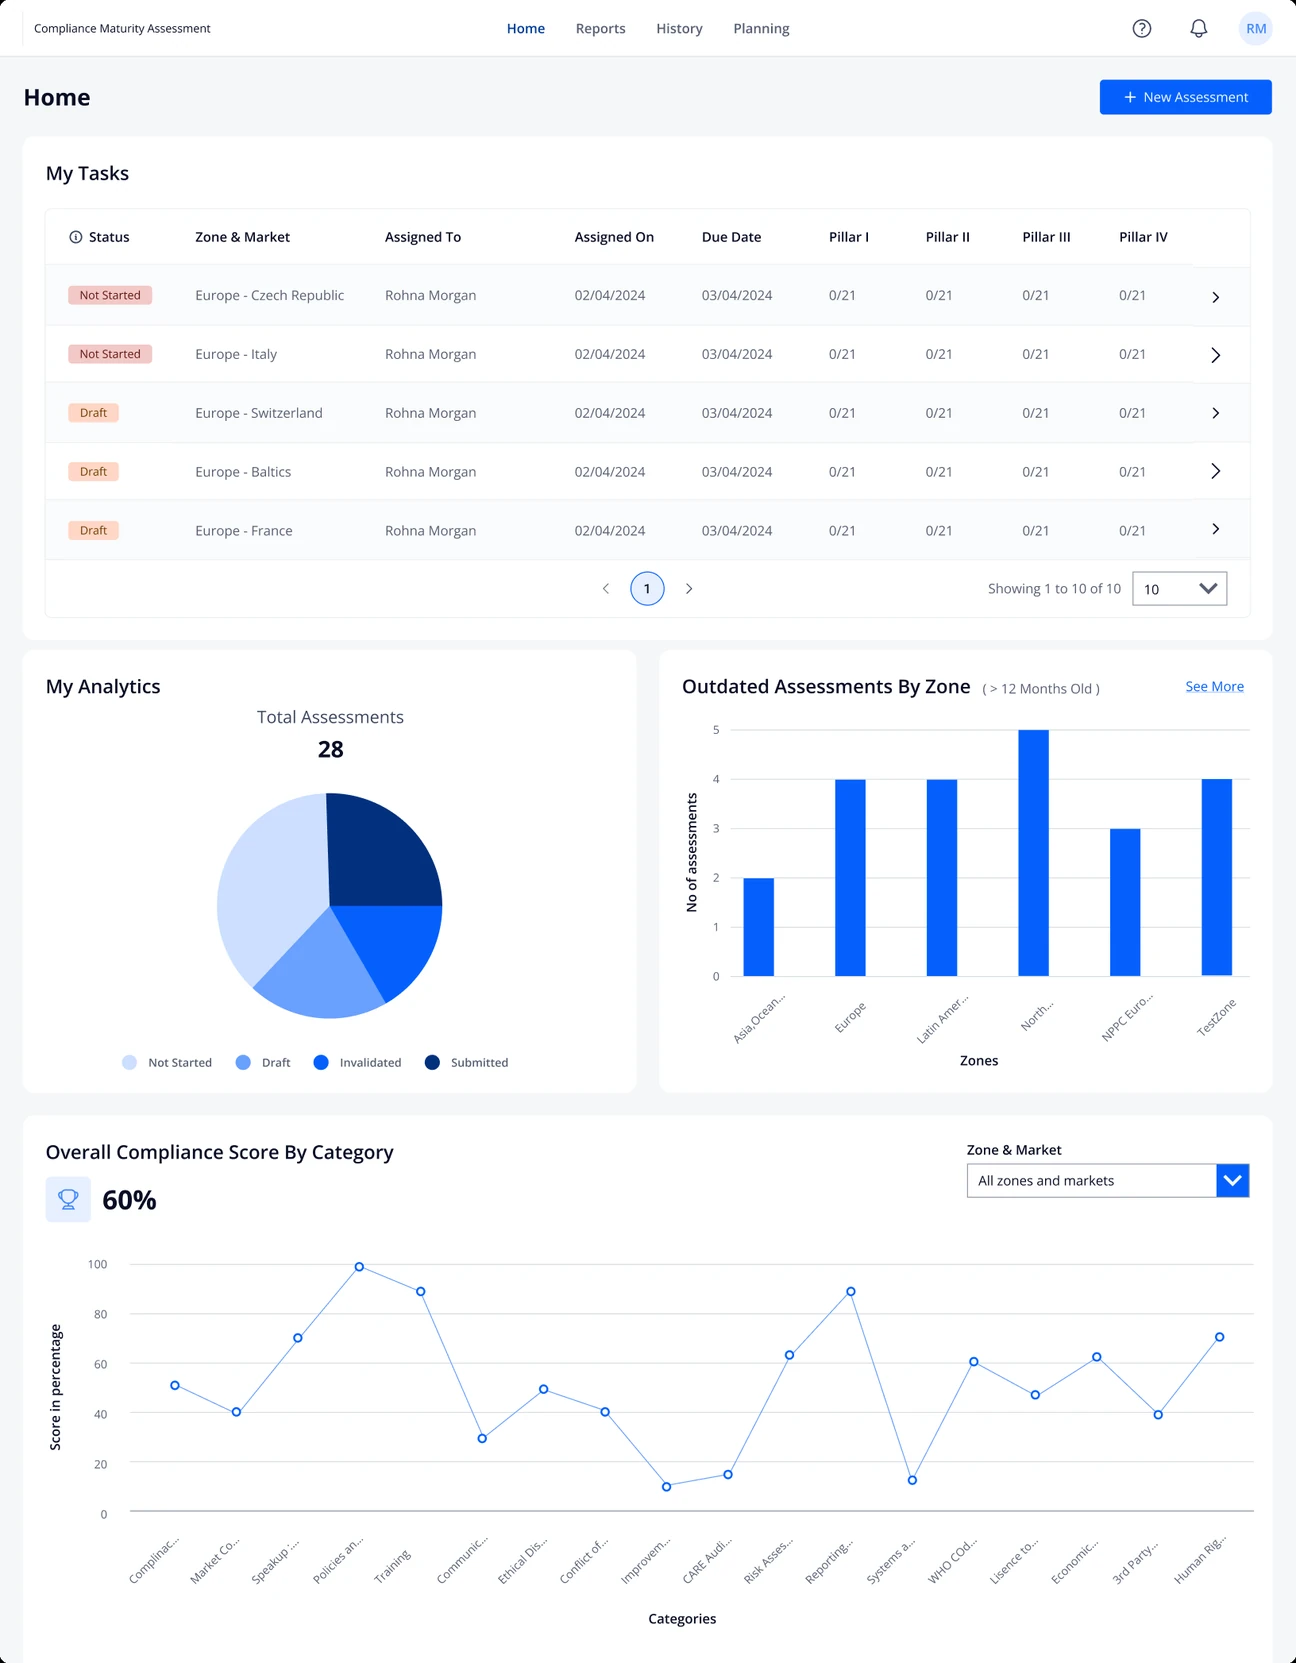
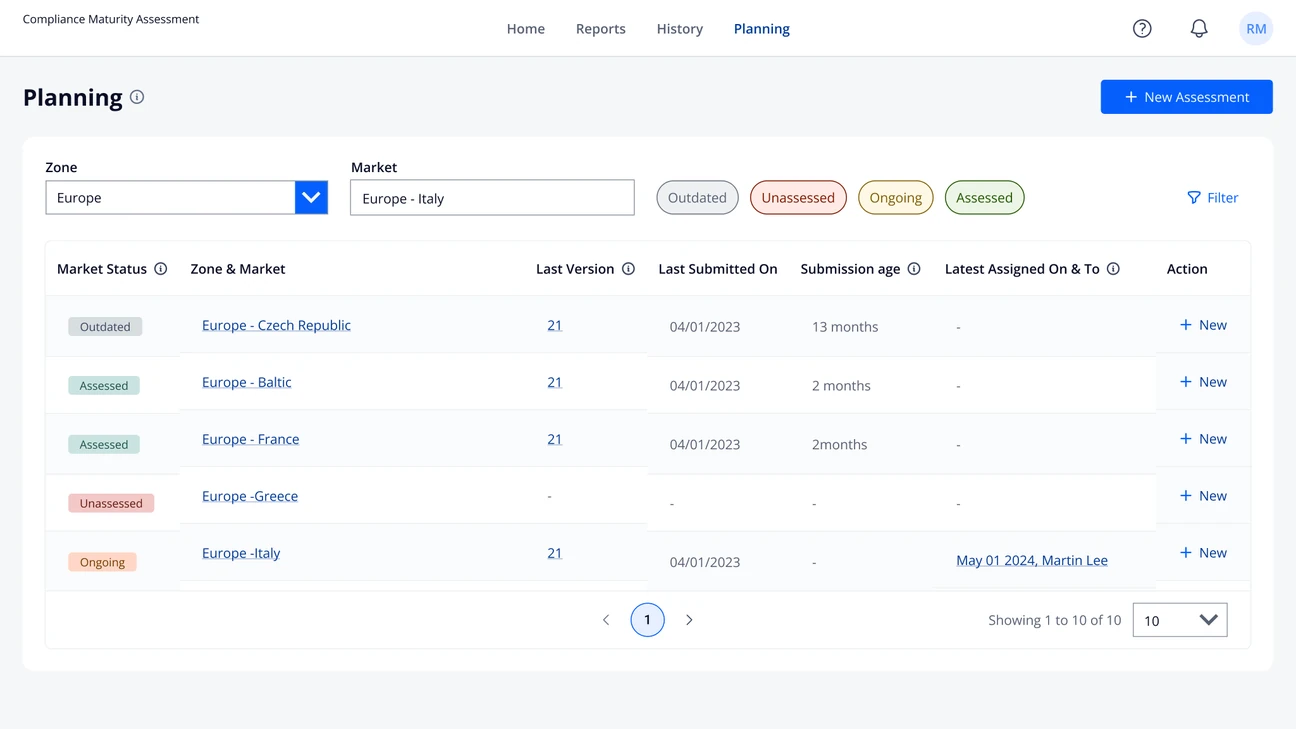
01 · Make status visible. No screen showed progress. Managers kept each market's progress in spreadsheets, and officers lost their place mid-assessment. Now every screen carries its own count: market status, questions answered per pillar, time since a market's last submission.
02 · Keep the memory in the tool. An assessment runs for weeks, sometimes months, and officers kept their own record of what they'd decided and how far they'd got. Now comments sit on their question, and the work left on Friday is still there on Monday.
03 · Make scores defensible. A score was a coloured dot, and what 0 to 5 meant sat in a legend at the top. A colour makes you recall that legend, just when an auditor is asking. A number reads like a school grade. So every score names its number, the colour stays as a quick cue, and the criteria are close at hand.
05The difficulties
But Power Apps only saved when told to
Without a fix, an officer's progress depended on remembering to press save.
We had assumed the app recorded each score as it went. It didn't. Power Apps saves only when the user asks, because saving constantly is too heavy for it. Without a fix, keeping an officer's place would mean trusting them to press save.
So the app learned when to save
Custom components now force a save wherever progress could be lost.
With the engineer, we built custom components that force a save at the points where progress could be lost. The save button stayed, with a safety net behind it. Charts hit a similar limit, so they show headline numbers and link to Power BI.
More detail
Why the charts changed
The charts I designed needed more than Power Apps' built-in visuals could show. The alternative was to link straight out to Power BI, which meant nobody would see any data unless they left the tool.
So the charts in the app became simpler: headline numbers only, with a direct link to the Power BI screens for depth. It was a real limit on what I'd planned. The richer analytics are staged as future work.
06The redesign
Now the tool opens on the work, not on three buttons
Where was I
Scores you can defend
New screen · Every market on one page
New screen · What's overdue
07Impact
Officers stopped using the spreadsheets
Impact · whole product
Faster assessments
4×
Speed
User satisfaction
+45%
Sat
The client reported it after launch. For a tool people worked around, being used was the result.
That's what the client reported after launch, along with assessments running four times faster and user satisfaction up 45%. For a tool people had worked around, simply being used was the result that mattered most.
More detail
How I'd measure this properly
These numbers come from the client's post-launch report. I didn't run the measurement and can't verify its method, so I read them as a strong direction, not a controlled result.
Spreadsheet activity. The spreadsheets lived on SharePoint, so their edit history shows whether the work really moved into the tool.
Use of the new screens. Views and engagement on the home and planning screens: whether managers open them, and how often.
A manager's week. Shadowing a manager for a week, to see where oversight actually happens now.
08Role
Monday now starts where Friday ended
Within Power Apps' limits, a tool people worked around became the place the work happens.
Power Apps set hard limits, so I ran every idea past the engineer before it went further. Within those limits, a tool people worked around became the place the work happens. The officer who stops on Friday now finds their place waiting on Monday.
More detail
How the details served the goal · What I learned
01 · How the details served the goal
· Context that persists, for work that spans weeks, not sittings
· A hierarchy that lets a manager scan global status in seconds
· Scores that are explicit and defensible: labels and criteria, never colour alone
02 · What I learned
Habits outlast a better design. Even with the new tool, some people fell back on email and spreadsheets under pressure. An old habit is the low-effort path, and under time pressure people take it. A better destination isn't enough: the new path has to be easier than the habit.
Plan for the ceilings up front. Power Apps capped the analytics, and I had to scope dashboards down. The habit and the platform both have to be designed for from the start, not discovered at the end.
Next · Case 03
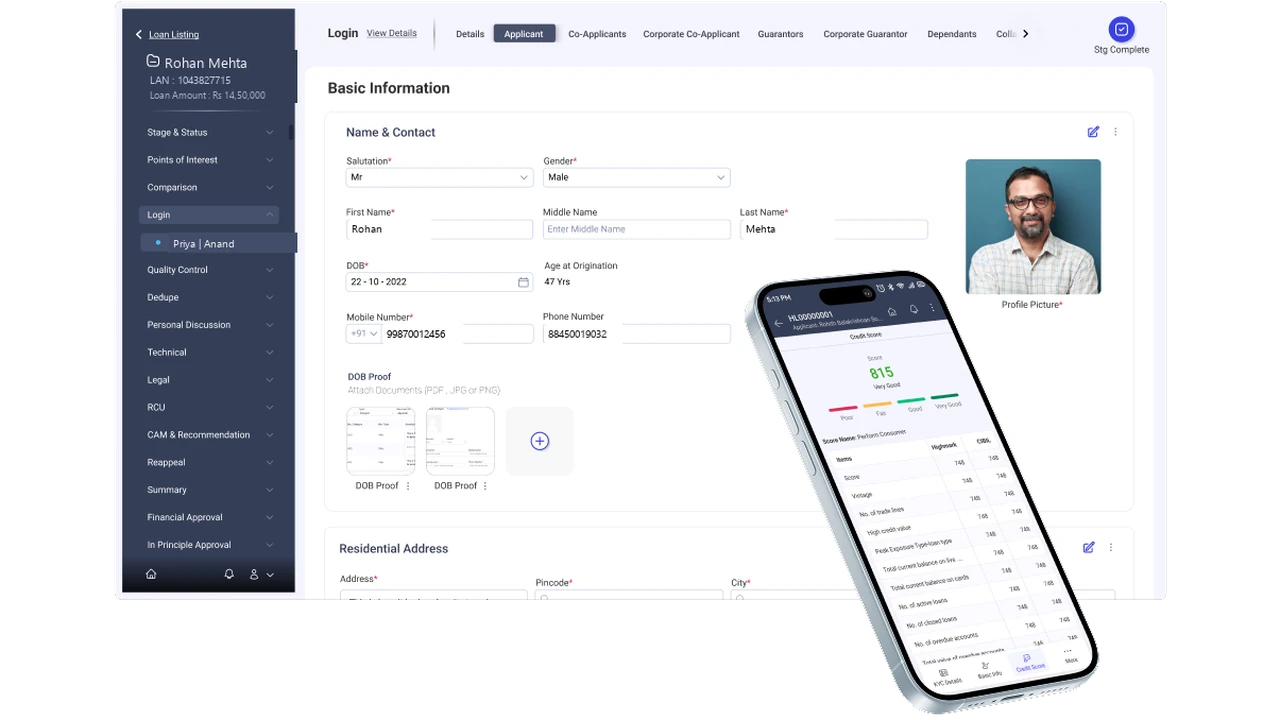
The Sales Part of a Loan Origination System
Getting a loan application right the first time, far from any signal.Field revisits
−67%